UPort OpenOCD Debugger Configuration
The OpenOCD version built into UPort is 0.12.0.
This method only supports GCC + CMake toolchains. Keil and IAR toolchains are not supported.
See the OpenOCD documentation or website for more information:
Before you begin, make sure a debugger such as STLINK, JLINK, or CMSIS-DAP is connected to the UPort USB port.
After opening the UPort web backend, click "OpenOCD" to view the OpenOCD debugger configuration page.
Step 1: Check the UPort Configuration
After plugging in the debugger, click the refresh button. UPort automatically detects the debugger type and displays it in the interface.
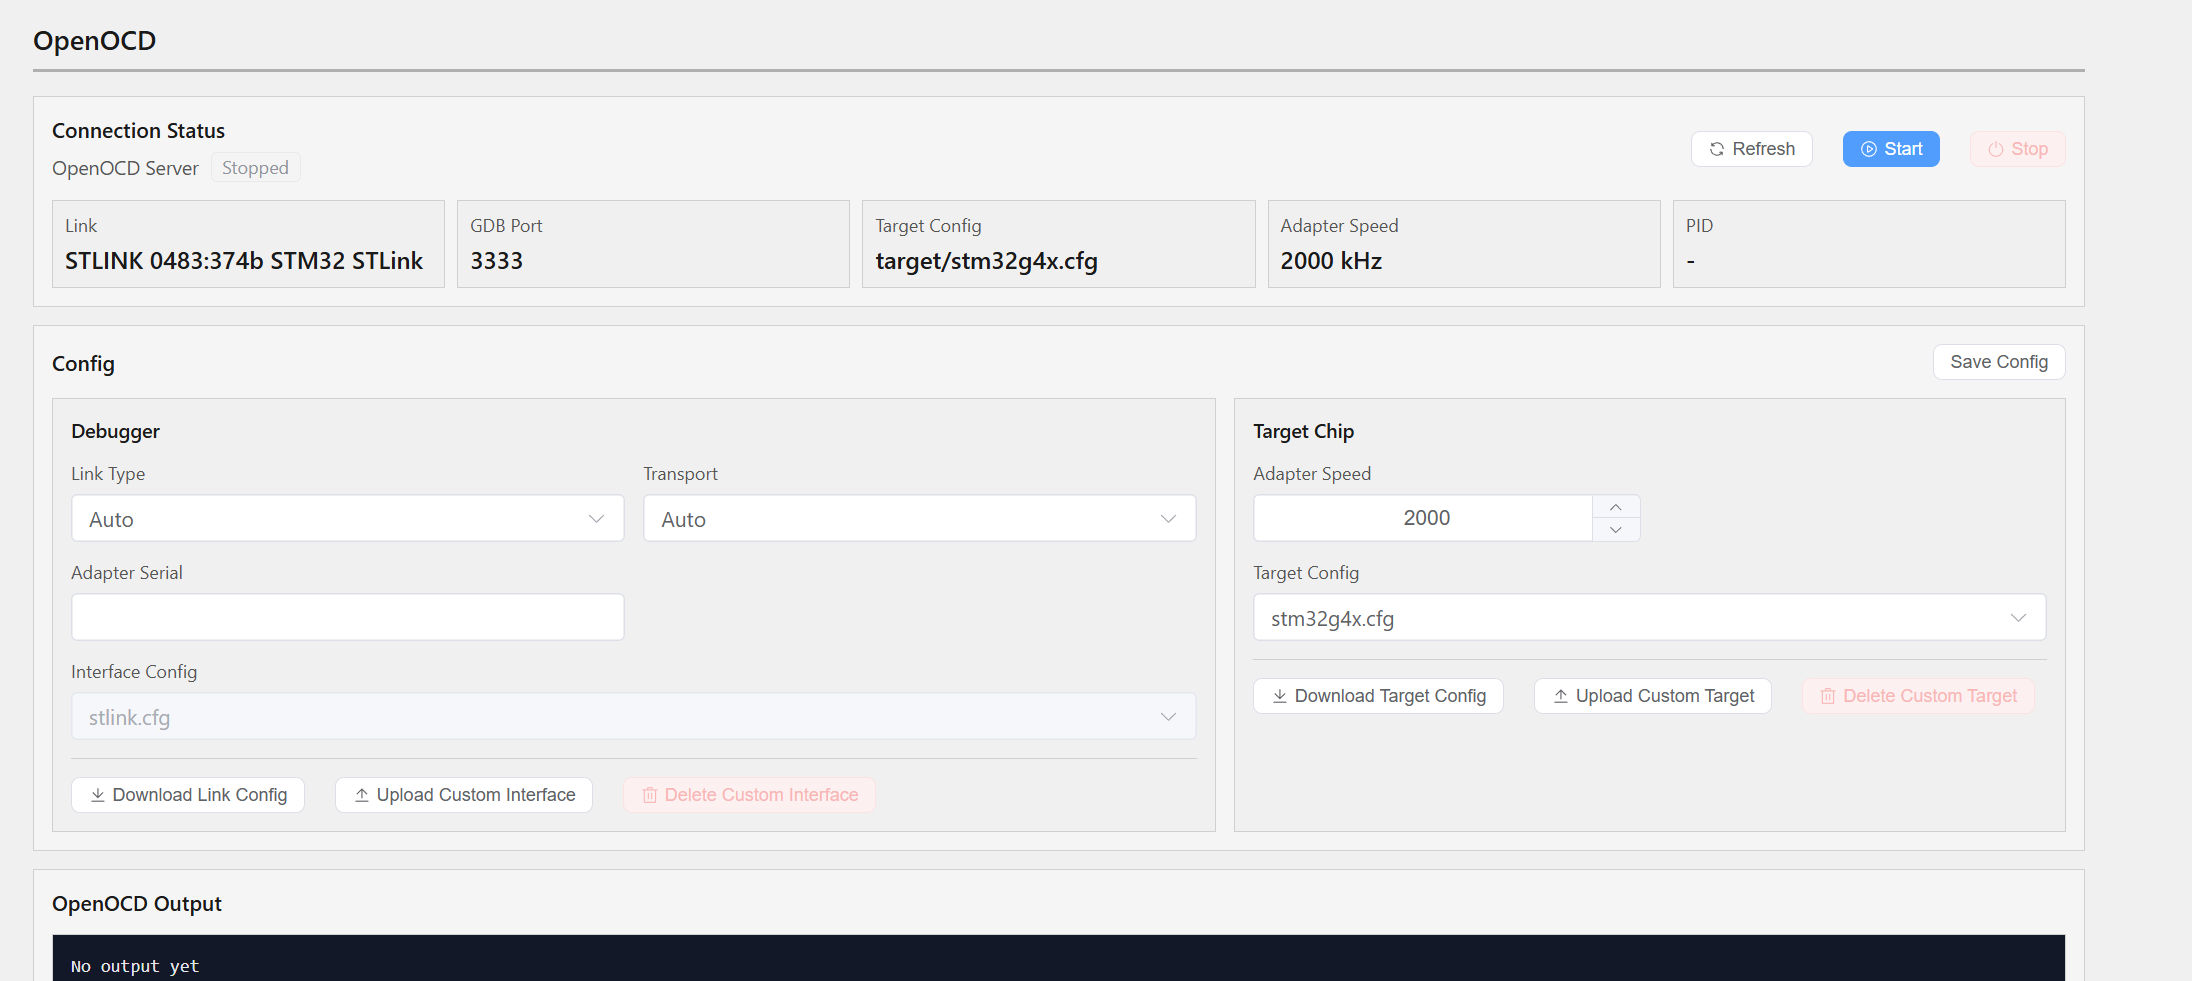
If the automatic detection is incorrect, you can manually adjust the settings in the next steps.
Step 2: Configure the OpenOCD Debugger
By default, UPort automatically detects the debugger type and selects the corresponding OpenOCD configuration file.
You can also manually select the debugger and the SWD or JTAG debug interface.
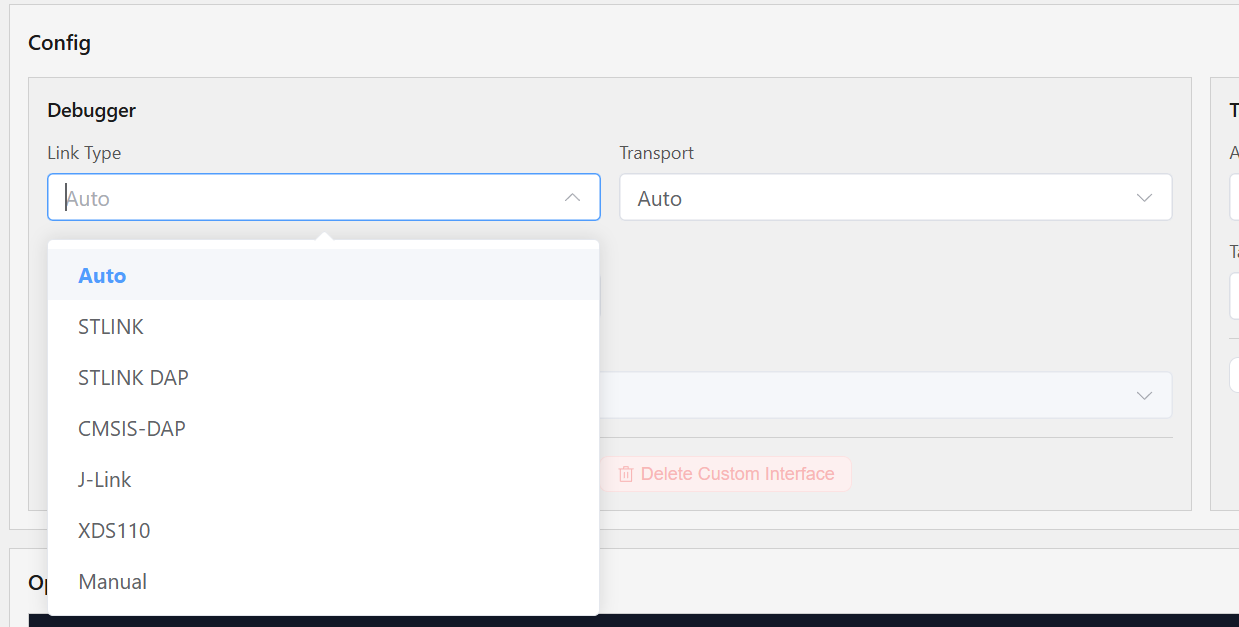
For example:
- If you use an STLINK debugger, select
STLINKand choose theSWDinterface. - If you use a JLINK debugger, select
JLINKand choose theSWDinterface. - If you use a CMSIS-DAP debugger, select
CMSIS-DAPand choose theSWDinterface.
To use a custom cfg file, select Upload custom interface, then manually set the link type to Custom.
Step 3: Configure the OpenOCD Target
This option must be configured manually. An incorrect target configuration can prevent OpenOCD from connecting to the target device.
The default speed is 2000 KHz. In Target Configuration, you can enter the target chip prefix to quickly find the corresponding OpenOCD configuration file.
For example:
- For an STM32F103C8T6 target, enter
stm32f1xand select thestm32f1x.cfgOpenOCD configuration file. - For an STM32F407VGT6 target, enter
stm32f4xand select thestm32f4x.cfgOpenOCD configuration file. - For a ZYNQ-7000 target, enter
zynqand select thezynq_7000.cfgOpenOCD configuration file.
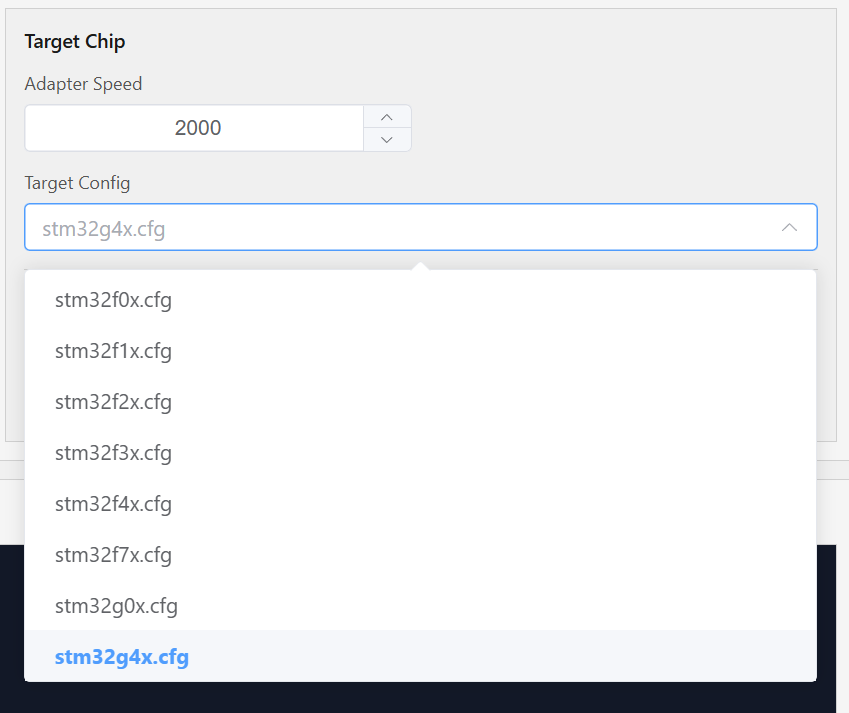
To further customize the OpenOCD target configuration file, select Upload custom target, then manually set the link type to Custom.
Step 4: Start the OpenOCD Service
After the configuration is complete, click the start button in the upper-right corner. UPort starts the OpenOCD service and displays OpenOCD log output.
The example below uses STM32G4 + STLINK. The debug activity LED blinks, and the log output appears as shown:
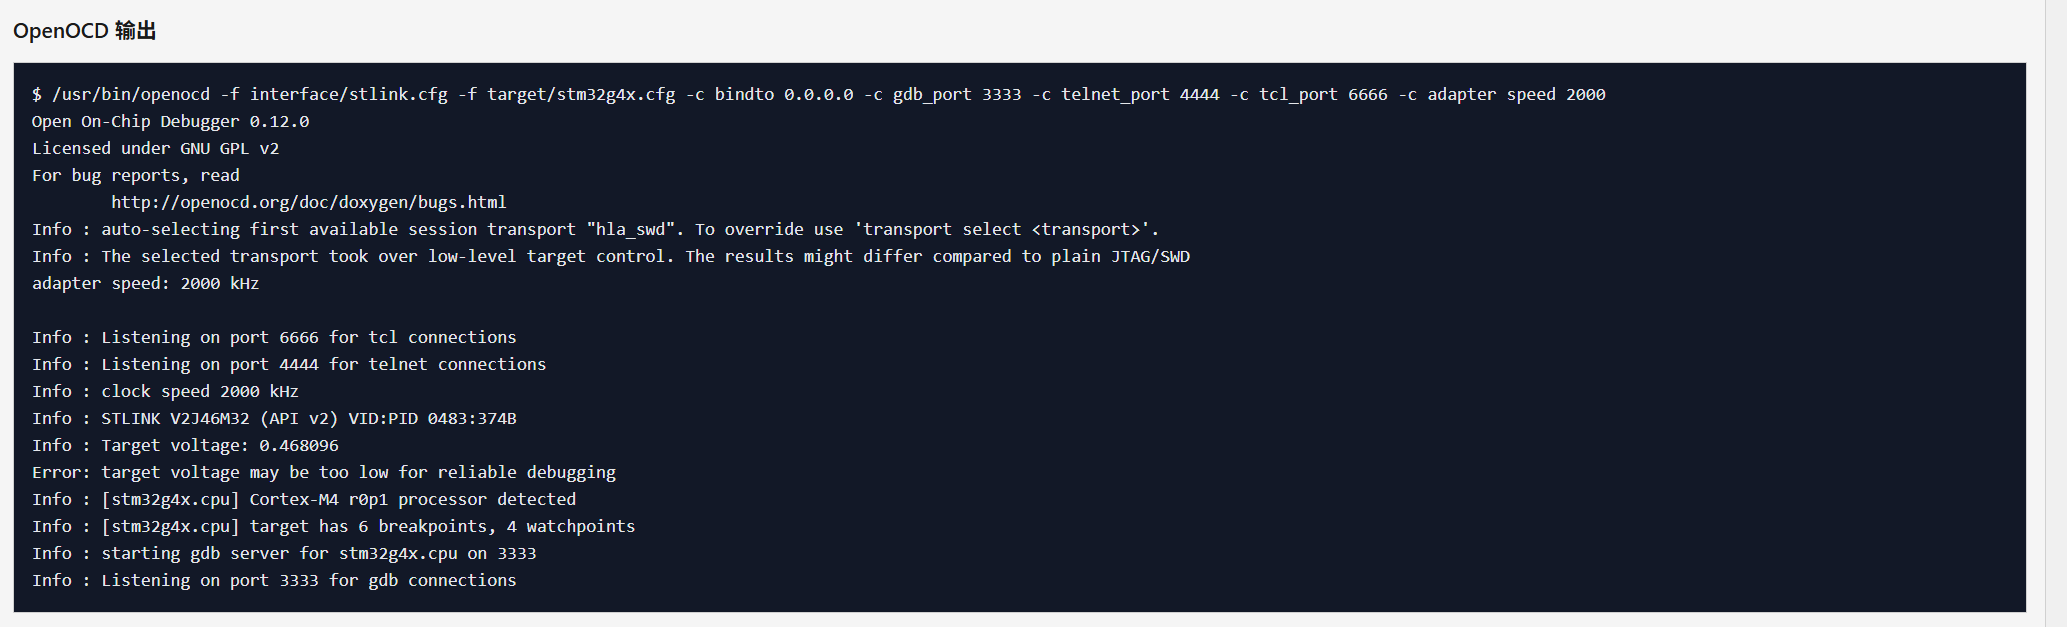
If there are no errors or warnings, the OpenOCD service has started successfully. At this point, the GDB port is running on port 3333, the Telnet port is running on port 4444, and the TCL command port is running on port 6666.
Step 5: Configure Remote VSCode or JetBrains CLion Launch Commands
The final step is to configure your IDE.
Stop the remote chip before starting a debug session. Connect to the UPort OpenOCD service over Telnet, then enter the reset halt command to halt the target chip.
VSCode
The following example uses VSCode and the STM32CubeMX for VSCode extension to debug an STM32G434. Configure the remote debug command as follows:
Manually replace the following values with the UPort IP address and the CMake Target name. After editing, place this block at the top level of .vscode/launch.json, inside the first JSON object.
"inputs": [
  {
    "id": "openocdIp",
    "type": "promptString",
    "description": "UPort / OpenOCD IP address",
    "default": "192.168.123.1"
  },
  {
    "id": "cmakeTarget",
    "type": "promptString",
    "description": "CMake target name without .elf",
    "default": "Please_input_your_CMake_target_name"
  }
]
The following is an example configuration. The default path is already set to the build output path for the RelWithDebInfo mode. To make source navigation work, replace {Path recorded in ELF debug info} with the absolute path of the project, such as /home/user/projects/.
After editing, add it to configurations in .vscode/launch.json:
{
  "name": "GDB: Remote OpenOCD ${input:openocdIp}:3333",
  "type": "cppdbg",
  "request": "launch",
  "cwd": "${workspaceFolder}",
  "program": "${workspaceFolder}/build/RelWithDebInfo/${input:cmakeTarget}.elf",
  "MIMode": "gdb",
  "targetArchitecture": "arm",
  "miDebuggerPath": "${command:st-stm32-ide-debug-launch.get-gdb-executable}",
  "sourceFileMap": {
    "{Path recorded in ELF debug info}": "${workspaceFolder}"
  },
  "stopAtEntry": false,
  "setupCommands": [
    {
      "description": "Disable GDB index cache warning",
      "text": "-gdb-set index-cache off",
      "ignoreFailures": true
    }
  ],
  "customLaunchSetupCommands": [
    {
      "description": "Load ELF symbols",
      "text": "-file-exec-and-symbols \"${workspaceFolder}/build/RelWithDebInfo/${input:cmakeTarget}.elf\"",
      "ignoreFailures": false
    },
    {
      "description": "Connect to remote OpenOCD",
      "text": "-target-select extended-remote ${input:openocdIp}:3333",
      "ignoreFailures": false
    },
    {
      "description": "Reset and halt target",
      "text": "-interpreter-exec console \"monitor reset halt\"",
      "ignoreFailures": true
    },
    {
      "description": "Load firmware",
      "text": "-target-download",
      "ignoreFailures": false
    },
    {
      "description": "Break at main",
      "text": "-break-insert main",
      "ignoreFailures": true
    }
  ],
  "launchCompleteCommand": "exec-continue"
}
If everything is configured correctly, click the VSCode debug button. The program is downloaded automatically and the debug session starts.
JetBrains CLion
See the official JetBrains CLion blog for remote debug command configuration.
For a Chinese reference, see this JetBrains CLion Zhihu article.
Other Configurations
If you plan to use another IDE, see the OpenOCD documentation and configure the remote debug command accordingly.